Since entering our lives in the early 2000s, social media has changed everything regarding marketing.
With so many people using social media, from the youngest to oldest generations and everyone in between, it is more crucial than ever for businesses to integrate it into marketing strategies to reach their target audiences.
However, an effective social media marketing strategy should always start with statistics.
As marketers, we know that brand success is directly linked with numbers, so we should always use legitimate sources to back up our social media initiatives.
Beyond using social media statistics for marketing to shape your online presence in 2024, they can also help you discover new prospects and increase business performance.
This is why we’ve put together these essential social media marketing stats every marketer should be aware of.
Read on to find out how to enhance your social media presence in 2024 with the help of data!
Crucial Social Media Marketing Facts [Key Findings]
- On average, people spend 2 hours and 24 minutes daily on social media.
- 55% of consumers state that they use social media to learn about new businesses.
- Social media usage is set to reach 4.89 billion people in 2023.
- More than 75% of the global population above 13 years old uses social media.
- 82% of people purchased a product found on social media through their phones.
- 76% of Americans expect brands to respond within 24 hours on social media.
- TikTok is the most used influencer marketing channel, leading with 56%.
How Popular Is Social Media Compared to Internet Usage Globally?
Let’s start with the basics.
As a marketer, you already know that social media is widely used by the global population, but if you want to level up your game, you have to dig deeper.
Below are some of the most interesting global marketing statistics for social media that highlight its popularity:
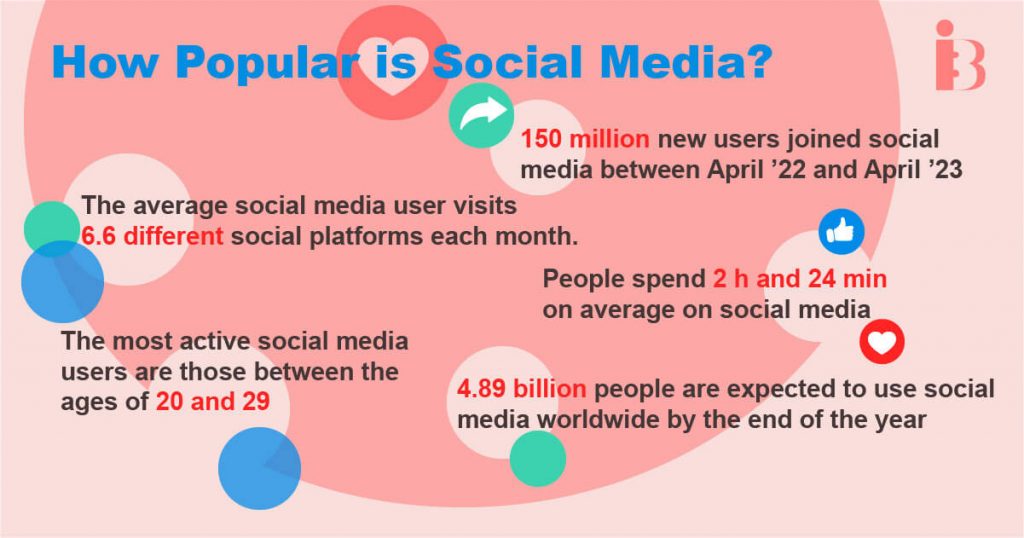
- 4.89 billion people are expected to use social media worldwide by the end of the year. As of April 2023, that number was 4.80 billion.
- The projected global growth of social media usage is 6.54% by the end of 2023.
- 150 million new users joined social media between April 2022 and April 2023, equalling a 3.2% year-on-year growth.
- The number of social media users is expected to grow exponentially in the next four years, reaching 5.85 billion in 2027.
- People spend 2 hours and 24 minutes on average on social media.
- The average social media user visits 6.6 different social platforms each month.
- Globally, 46.5% of social media users are female, and 53.5% are male.
- The most active social media users are those between the ages of 20 and 29.
- Northern and Western Europe are the regions where social media use is most prevalent. These localities have saturation rates of 85% and 84%, respectively.
Social Media in the United States
Social media has become an integral part of daily life for millions of Americans, reshaping communication, entertainment and business interactions. It’s a virtual town square, where people from all walks of life converge to share experiences and aspirations.
But what are the exact numbers? And is the American market a good fit for social media advertising?
Let’s take a closer look at the most recent US social media statistics:
- 92.1% of US marketers in organizations with more than 100 employees use social media as a marketing tool.
- The United States is the largest market for social media advertising spending, leading with $80.67 billion in 2022. China is just behind with $80.55 billion.
- 246 million Americans use social media, which is equivalent to 72.5% of the US population.
- 235.1 million US residents above 18 years old were using social media as of January 2023.
- 79% of the total internet users in the US had used at least one social media platform in January 2023.
- By 2028, 331.09 million Americans are expected to be on social media.
Social Media Usage by Device
A few years ago, desktops were the main device for accessing the internet. However, times have changed.
While most social media users still own at least one desktop device for work, school, or video games, marketing statistics show that smartphones are the main device for getting online in developing countries.
This statistic is crucial when outlining your social media strategy for next year, as content must be primarily suitable for mobile.
Let’s have a look at the most fascinating social media usage statistics by device:
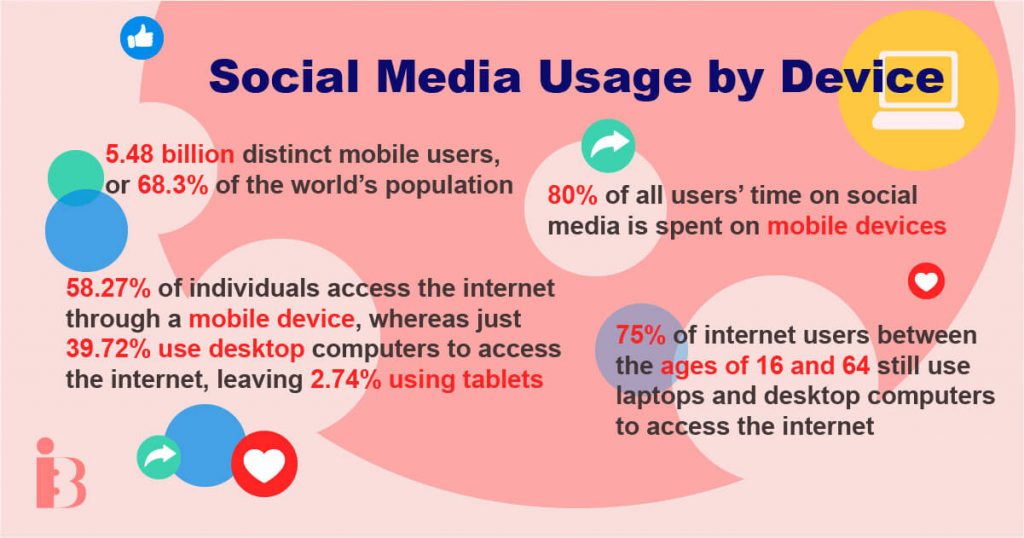
- As of April 2023, there are 5.48 billion distinct mobile users, or 68.3% of the world’s population.
- 80% of all users’ time on social media is spent on mobile devices, including both smartphones and tablets.
- 82% of shoppers had bought a product directly from their mobile phones after discovering it on social media.
- 58.27% of individuals access the internet through a mobile device, whereas just 39.72% use desktop computers to access the internet, leaving 2.74% using tablets.
- Predictions suggest that 72% of all internet users will access the web solely via smartphones by 2025.
- Despite mobile prevalence, 75% of internet users between the ages of 16 and 64 still use laptops and desktop computers to access the internet.
How Do Social Media Users Engage With Content?
In the world of social media, visual content is king.
Beyond images, video content has increased massively in popularity in recent years, and the technology of creating videos is simpler than ever.
The following social media video statistics show that video content hasn’t lost its appeal; on the contrary, it is more likely to be shared on social media.
The data also reveals that social media platforms don’t always retain video marketing content. Instead, the influence of content producers frequently goes well beyond their primary media.
- Visual formats are 40x more likely to be shared on social media than other sorts of material.
- You can increase your engagement rate by 79% on Instagram posts by tagging the location.
- Your landing page’s conversion rate can rise by 80% if you include a product video. Videos might also result in more sales. 74% of people who viewed an explanatory video about a product/service purchased it.
- 42.7% of global internet users use ad blockers while on social networks.
- Social media videos brought in a new consumer for 93% of brands.
- Although shorter movies tend to be more popular overall, younger viewers prefer lengthier ones.
Social Media User Relationships with Brands
Social media marketing has become one of the most used channels in the digital world.
Nowadays, people use social media to keep in touch with friends and family, fill their spare time, read news stories, and find content, but also to do research before buying a product or service.
This is one of the many reasons why businesses that don’t have a social media presence are missing out on opportunities to build a solid brand image.
Besides, social media has the advantage of putting your brand in front of other audiences (especially younger ones) that other marketing channels might lack.
If you’re not convinced yet, listed below are the most popular social media marketing stats, showing the relationship between users and brands:
- 76.1% of global social media users said they use social media platforms for brand research, while 43.5% use social networks for the same reason.
- 54% of internet browsers use social media to research products.
- 49% of consumers say they rely on recommendations from social media influencers to make shopping decisions.
- 71% of customers are likely to tell their friends and family about a brand after having a positive encounter with it on social media.
- Nearly 40% of consumers between the ages of 18 and 34 have purchased a product through social media.
- Every month, 1 in 4 customers watch a brand’s video.

Interesting Channel-Focused Social Media Marketing Statistics
While having an overview of the whole social media industry is mandatory for marketers, the best ones differentiate themselves by adapting their strategy according to each channel’s specifics.
What works best on Facebook might underperform on Twitter, for example.
Each platform’s algorithm plays by different rules, and we, as digital marketers, should always try to stay ahead of the game by running tests, adopting trends, and tailoring our content.
Continue reading to discover relevant channel-focused social media marketing statistics that will come in handy for any comprehensive strategy.
Facebook Marketing Stats
- Facebook is the most used social media platform globally, with nearly 2.96 billion active users each month.
- The top three reasons for using Facebook are to message friends/family, post/share photos/videos, and keep up-to-date with news/the world.
- On average, users spend 19.6 hours per month on Facebook globally.
- 37.2% of the total world population actively use Facebook each month.
- The average Facebook post engagements (reactions, comments, and shares) vs. page fans for all post types is 0.07%.
- 7 out of 10 Facebook users in the United States visit the app at least once per day.
- 1.8 billion people use Facebook groups monthly.
- By 2027, the number of Facebook users is expected to reach 254.26 million in the United States.
Instagram Marketing Stats
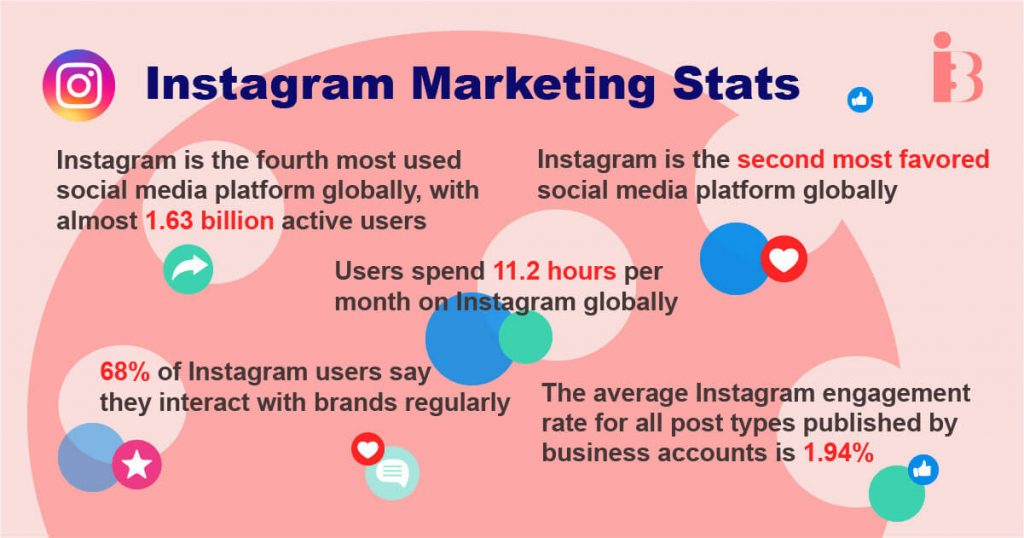
- Instagram is the fourth most used social media platform globally, with almost 1.63 billion active users.
- Instagram is the second most favored social media platform globally as chosen by 14.8% of internet users aged 16 to 64.
- The top three reasons for using Instagram are to post/share photos/videos, find funny/entertaining content, and message friends/family.
- On average, users spend 11.2 hours per month on Instagram globally.
- 68% of Instagram users say they interact with brands regularly.
- The average Instagram engagement rate for all post types published by business accounts is 1.94%.
- Instagram carousel posts have the highest reach rates. They also increase the median number of likes per post on Instagram, regardless of the account’s size.
- In 2023, Instagram lost its first place as the most popular influencer marketing platform to TikTok.
- The most used Instagram hashtags are #love, #Instagood, #fashion, #photooftheday, and #art.
The most popular Instagram accounts based on number of followers are:
- Christiano Ronaldo
- Kylie Jenner
- Lionel Messi
- Ariana Grande
Twitter Marketing Stats
- On average, users spend 5.1 hours per month on Twitter globally.
- The total potential reach of ads on Twitter is 372.9 million users.
- The average Twitter user posts only 2 tweets per month, but 10% of users who are the most active in terms of volume, tweet 138 times every month.
- The top three reasons for using Twitter are to keep up-to-date with news/the world, find funny/entertaining content, and follow/find information about products and brands.
- The top 10% of most active tweeters are generally women and focus more on politics.
The most popular Twitter accounts based on number of followers are:
- Barack Obama
- Justin Bieber
- Katy Perry
- Rihanna
- Cristiano Ronaldo
LinkedIn Marketing Stats:
- LinkedIn has more than 930 million members in more than 200 countries and territories worldwide.
- The top three reasons for using LinkedIn are to keep up-to-date with news/the world, follow/find information about products and brands, and post/share photos/videos.
- The total potential reach of ads on LinkedIn is 922.3 million users.
- LinkedIn’s average click-through rate (CTR) is 3.49%.
- Native documents have the potential to generate 5x more clicks than any other content on the platform, reaching a CTR of 8% to 13%.
- The average engagement rate by impressions for video posts on LinkedIn is 3.18%.
- 87 million of the nearly 2 billion millennials on the planet use LinkedIn.
- Users who include a photo receive up to 21 times more profile views and up to 36 times more messages.
The most followed LinkedIn brands based on number of followers are:
- Amazon
- Ted Conferences
- Forbes
The most followed LinkedIn individual accounts based on number of followers are:
- Bill Gates
- Richard Branson
- Jeff Weiner
- Arianna Huffington
- Satya Nadella
TikTok Marketing Stats
- TikTok is the fastest-growing social media platform the internet has ever known, with a whopping 105% user growth rate in the United States between 2020 and 2022.
- On average, users spend 19.6 hours per month on TikTok globally.
- People spend the most time on the TikTok app in the UK – 27.3 hours per month on average. Russia and the USA are second and third, with 26.3 hours and 25.6 hours, respectively.
- TikTok’s potential ad reach is 1.09 billion users over 18 years old, which is equivalent to 13.6% of Earth’s population.
- 116.5 million Americans aged over 18 actively use TikTok.
- TikTok’s average engagement rate by video views is 6.72%, while the average watch rate is 16.23%.
- 53.4% of TikTok’s users are women; 46.6% are men.
- TikTok’s audience comprises predominantly of users aged 18 to 24, equalling 419.9 million people.
- On average, TikTok accounts post 20 videos per month on the platform.
The most popular TikTok accounts based on number of followers are:
- Charli D’Amelio
- Khabane Lame
- Bella Poarch
- Addison Rae
- Zach King
Pinterest Statistics and Facts
- Each month, 445 million people worldwide use Pinterest for inspiration and ideas.
- Pinterest’s global revenue amounted to $2.8 billion in 2022, which is 9% higher than the year before.
- More than 60% of Pinterest’s users are women; 40% are men.
- Generation Z Pinners’ year-over-year growth is 40%.
- For 61% of Pinterest users, the platform is their go-to place to start a new project.
- 46% of weekly Pinners say that they’ve discovered a new product or brand on Pinterest.
- According to Pinterest’s Business page, ads on the network have a 2x higher return on ad spend for retail brands and a 2.3x higher cost per conversion than other social media.
- 93.68 million people in the US use Pinterest.
- Pinterest’s annual revenue in the United States and Canada is $2.3 billion, while in Europe it amounts to $398 million.
- By 2027, 98.62 million Americans are expected to be using Pinterest.
Unleash the power of Pinterest to drive traffic and engagement for your blog like never before—learn how to use Pinterest for blogging.
Youtube Statistics
- YouTube is the second most popular social network, with 2.51 billion active monthly users. It falls behind Facebook with approximately 2.96 billion users.
- In February 2023, YouTube Shorts surpassed the threshold of 50 billion daily views.
- Nearly 90% of YouTube.com’s traffic comes from mobile devices. With 10% from desktops, respectively.
- YouTube’s worldwide advertising revenue was $29.24 billion in 2022. That’s a 1.53% growth from the previous year and 11.35% of Google’s total revenue.
- YouTube is the fourth most used social media platform by marketers, with 52% leveraging the platform. It lags behind Facebook (90%), Instagram (79%) and LinkedIn (62%).
- 95% of US teens say they use YouTube, giving it the gold medal among teenage users. TikTok and Instagram follow with 67% and 62%.
- The most viewed YouTube video is “Baby Shark Dance” on the Pinkfong Baby Shark – Kids’ Songs & Stories channel. It hit a record of 12.3 billion lifetime views and is the first video on the platform to top 10 billion views.
- 500 hours of video are uploaded to YouTube every minute.
- YouTube.com is the second most visited website in the world, following its “big brother” Google.com.
Fun social media fact: YouTube Shorts were first tested in India in 2021, after TikTok was banned in the country. After the first year of its launch, YouTube’s short-form videos reached 30 billion total daily views globally.
The most popular YouTube channels based on the number of users are:
- T-Series
- YouTube Movies
- Cocomelon – Nursery Rhymes
- SET India
- MrBeast
Social Media Advertising Statistics
Social media platforms have billions of users worldwide who spend hours scrolling, liking and sharing content every day.
But how effective is social media advertising for businesses?
What are the latest trends and statistics that marketers should know?
Let’s find out:
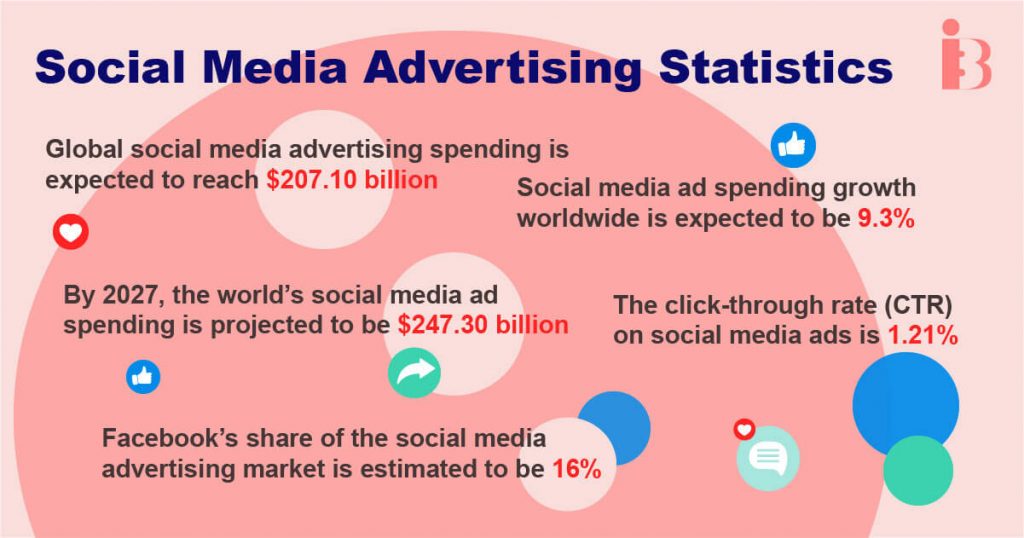
- Global social media advertising spending is expected to reach $207.10 billion by the end of 2023.
- Social media ad spending growth worldwide is expected to be 9.3%.
- Most of the social media ad spend in 2023 is coming from the United States, leading with over $72 billion.
- By 2027, the world’s social media ad spending is projected to be $247.30 billion.
- The click-through rate (CTR) on social media ads is 1.21%.
- Facebook’s share of the social media advertising market is estimated to be 16%.
More Social Media-Related Stats
More and more businesses nowadays have understood the colossal value of social media marketing and the vast opportunities that arise from cultivating a strong social media presence.
Even small businesses are working to quickly establish a social media presence in an effort to elevate brand recognition and raise the typical engagement rate of their posts.
Influencer marketing, messenger marketing, and account-based marketing are just three types of social media marketing that can give a boost to any brand.
Influencer Marketing Stats
- 68% of marketing organizations collaborate with social media influencers.
- 22.6% of internet users aged 16 to 64 follow influencers and experts on social media.
- Influencer marketing is expected to increase in value to $21.1 billion in 2023, as opposed to $16.4 billion in 2022.
- 61% of companies have worked with influencers they already know from different campaigns.
- 62.9% of marketers plan to use machine learning and artificial intelligence to find influencers and create campaigns.
- 60.4% of businesses admit they’ve used a virtual influencer (a digital character that acts like a real human) in their campaigns.
- According to Hubspot’s survey, 80% of marketers work with micro-influencers with under 100K subscribers/followers. In contrast, just 16% of marketers claim to work with mega influencers who have more than 1 million followers.
Messenger Marketing Stats
- The most widely used messaging platforms worldwide are WhatsApp and Facebook Messenger. Although Facebook Messenger dominates the North American market, WhatsApp wins the race overall, and its advantage has grown over the past few quarters.
- Facebook Messenger has 931 million monthly active users.
- The most distinctive messaging apps among Gen Z users are also the ones that have experienced the greatest recent growth—Telegram and Discord.
- Beyond Facebook, Messenger is the second most downloaded iOS app of all time. On Android, Messenger has been downloaded over 1 billion times.
- Every month, people send over 21 billion photographs via Messenger to their friends.
Account-Based Marketing Stats
- Finding target contacts and researching accounts are the top two account-based marketing (ABM) strategies.
- Companies spend 29% of their marketing budgets on ABM on average.
- ABM is used by 94% of marketers.
- 90% of businesses cite new business creation as their primary ABM strategy objective.
- 56% of marketers think that a successful ABM strategy depends on personalized content.
AI in the Social Media Market
As artificial intelligence (AI) invades the digital world with full force, social media is also seeing the effects. The rapid growth of AI and machine learning technologies has an impact on marketers in terms of implementation and strategizing. This new technology requires a new way of thinking and rethinking what we already know.
Now, let’s jump right in to the AI social media market stats:
- In 2023, AI in the social media market is expected to reach $2.2 billion.
- The market size of artificial intelligence in social media is projected to reach $12 billion by 2031.
- A ten-year forecast shows that the compound annual growth rate (CAGR) of AI in social media is set to grow by 28.7% between 2022 and 2031.
- North America holds the largest market size in AI social media integrations and continues to increase investments in the industry.
- The Asia-Pacific market is forecasted to have the highest CAGR of the global artificial intelligence in social media market from 2022 to 2031, leading with 31.7%.
If you want to write awesome social media ads with AI, read my comprehensive AdCreative AI review.
Final Thoughts
For brands and marketers who are still unsure of the potential of social media marketing, these statistics provide compelling proof.
Marketers and brands can reach and engage consumers most effectively on social media for both B2C and B2B products.
As far as the customer is concerned, social media is the place to be.
Social media has become a key source of information for customers, so it’s important not to overlook content development.
I hope these statistics for social media marketing have inspired you to level up your strategy for next year.
Unlock the secrets of success in your marketing strategy by exploring the latest digital marketing statistics—read the article now!
FAQ
How much marketing is done on social media?
Social media ad spend is estimated to reach almost $270 billion globally in 2023. The previous year, that number was a little under $230 billion. The United States remains the largest social media ads market in the world.
What percentage of Americans use social media?
72.5% of Americans use social media in 2023, which corresponds to 246 million people. So the larger proportion of the US population actively uses social media platforms.
How many people use social media?
4.89 billion people are expected to use social media worldwide in 2023, compared to 4.59 billion in 2022. The projected growth is almost 6.54%.
What percentage of American businesses use social media?
The latest statistics for social media marketing show that 92.1% of US businesses with over 100 employees use social networks for marketing purposes.
References
- https://datareportal.com/social-media-users
- https://datareportal.com/global-digital-overview
- https://www.statista.com/statistics/278414/number-of-worldwide-social-network-users/
- https://hootsuite.widen.net/s/gqprmtzq6g/digital-2022-global-overview-report
- https://www.smartinsights.com/mobile-marketing/mobile-marketing-analytics/mobile-marketing-statistics/
- https://www.hootsuite.com/resources/digital-trends
- https://gs.statcounter.com/platform-market-share/desktop-mobile-tablet
- https://www.bankmycell.com/blog/how-many-phones-are-in-the-world
- https://datareportal.com/reports/digital-2020-global-digital-overview
- https://buffer.com/resources/infographics-visual-content-marketing/
- https://www.socialpilot.co/blog/social-media-statistics
- https://www.dreamgrow.com/8-reasons-why-your-business-should-use-video-marketing/
- https://backlinko.com/ad-blockers-users
- https://animoto.com/blog/news/social-video-trends-marketers-2020
- https://304927.fs1.hubspotusercontent-na1.net/hubfs/304927/Social%20-%20GWI%20Report%20-%20Website.pdf
- https://www.gwi.com/reports/social
- https://digitalmarketinginstitute.com/blog/20-influencer-marketing-statistics-that-will-surprise-you
- https://www.oberlo.com/blog/social-media-marketing-statistics
- https://www.semrush.com/blog/online-shopping-stats/
- https://www.pewresearch.org/internet/fact-sheet/social-media/
- https://www.facebook.com/community/whats-new/power-virtual-communities/
- https://www.statista.com/statistics/408971/number-of-us-facebook-users/
- https://www.ecommerceceo.com/why-brands-should-embrace-instagram-instead-of-facebook/
- https://www.socialinsider.io/blog/instagram-engagement/#8
- https://influencermarketinghub.com/influencer-marketing-benchmark-report/
- https://www.pewresearch.org/internet/2019/04/24/sizing-up-twitter-users/
- https://about.linkedin.com/
- https://www.socialinsider.io/blog/linkedin-content-strategy-for-b2b/
- https://www.adweek.com/performance-marketing/millennials-on-linkedin-infographic/
- https://www.inc.com/john-nemo/how-to-make-your-linkedin-profile-20x-more-appealing-according-to-science.html
- https://www.insiderintelligence.com/content/us-social-media-usage-2021
- https://www.socialinsider.io/blog/tiktok-benchmarks/#1
- https://blog.hubspot.com/blog/tabid/6307/bid/23865/13-mind-bending-social-media-marketing-statistics.aspx#social-media-report
- https://blog.hubspot.com/marketing/hubspot-blog-social-media-marketing-report
- https://www.statista.com/statistics/272014/global-social-networks-ranked-by-number-of-users/
- https://www.facebook.com/messengerfacts
- https://www.hubspot.com/state-of-marketing
- https://digitalmarketinginstitute.com/blog/your-guide-to-account-based-marketing
- https://www.spiceworks.com/marketing/marketing-automation/articles/75-account-based-marketing-abm-statistics-every-marketer-should-know/
- https://terminus.com/blog/2020-state-of-abm-report-preview/
- https://www.forrester.com/report/Forrester-Infographic-ABM-Maturity-Corresponds-To-Better-Revenue-Results/RES157155
- https://www.entrepreneur.com/growing-a-business/5-reasons-why-you-strong-social-media-presence/
- https://blog.hootsuite.com/social-media-statistics-for-social-media-managers/
- https://www.businessofapps.com/news/82-of-shoppers-use-social-media-to-make-a-purchase/
- https://sproutsocial.com/insights/social-media-response-time/
- https://www.statista.com/statistics/203513/usage-trands-of-social-media-platforms-in-marketing/
- https://datareportal.com/reports/digital-2023-united-states-of-america
- https://www.statista.com/statistics/456785/social-media-advertising-revenue-device-digital-market-outlook-worldwide/
- https://www.statista.com/topics/1538/social-media-marketing/#statisticChapter
- https://www.statista.com/outlook/dmo/digital-advertising/social-media-advertising/worldwide
- https://www.statista.com/statistics/278409/number-of-social-network-users-in-the-united-states/
- https://www.statista.com/forecasts/459813/social-media-advertising-revenue-countries-digital-market-outlook
- https://www.marketsandmarkets.com/Market-Reports/ai-in-social-media-market-92119289.html
- https://www.alliedmarketresearch.com/artificial-intelligence-in-social-media-market
- https://finance.yahoo.com/news/artificial-intelligence-ai-social-media-133800917.html
- https://www.statista.com/topics/1538/social-media-marketing/#topicOverview
- https://business.pinterest.com/en-gb/audience/
- https://www.statista.com/forecasts/1146884/pinterest-users-in-the-united-states
- https://www.statista.com/topics/2019/youtube/#topicOverview
- https://www.statista.com/statistics/277758/most-popular-youtube-channels-ranked-by-subscribers/
- https://www.statista.com/statistics/1256738/youtubecom-monthly-visits-distribution-by-device/
- https://www.statista.com/statistics/289658/youtube-global-net-advertising-revenues/
- https://www.statista.com/statistics/289659/youtube-share-of-google-total-ad-revenues/
- https://www.statista.com/statistics/259379/social-media-platforms-used-by-marketers-worldwide/
- https://www.statista.com/topics/1267/pinterest/#dossier-chapter2
- https://www.similarweb.com/top-websites/
- https://datareportal.com/essential-facebook-stats
- https://datareportal.com/essential-instagram-stats
- https://datareportal.com/essential-twitter-stats
- https://datareportal.com/essential-linkedin-stats
- https://datareportal.com/essential-tiktok-stats
You might also like:


Article by
Nikola Baldikov