14 billion hours. This is the amount of time we all collectively spent on mobile devices daily in the last year. Thanks to faster and more reliable networks like 5G, staying connected is easier than ever.
But you probably want to know, “What does this mean for marketers?”
For those finding themselves here, I have the research-backed data to answer your questions. In this post, I’ve gathered the latest mobile marketing statistics and trends that will completely reshape your digital strategies.
Let’s hop right in.
Essential Mobile Marketing Statistics for 2025 [Key Findings]
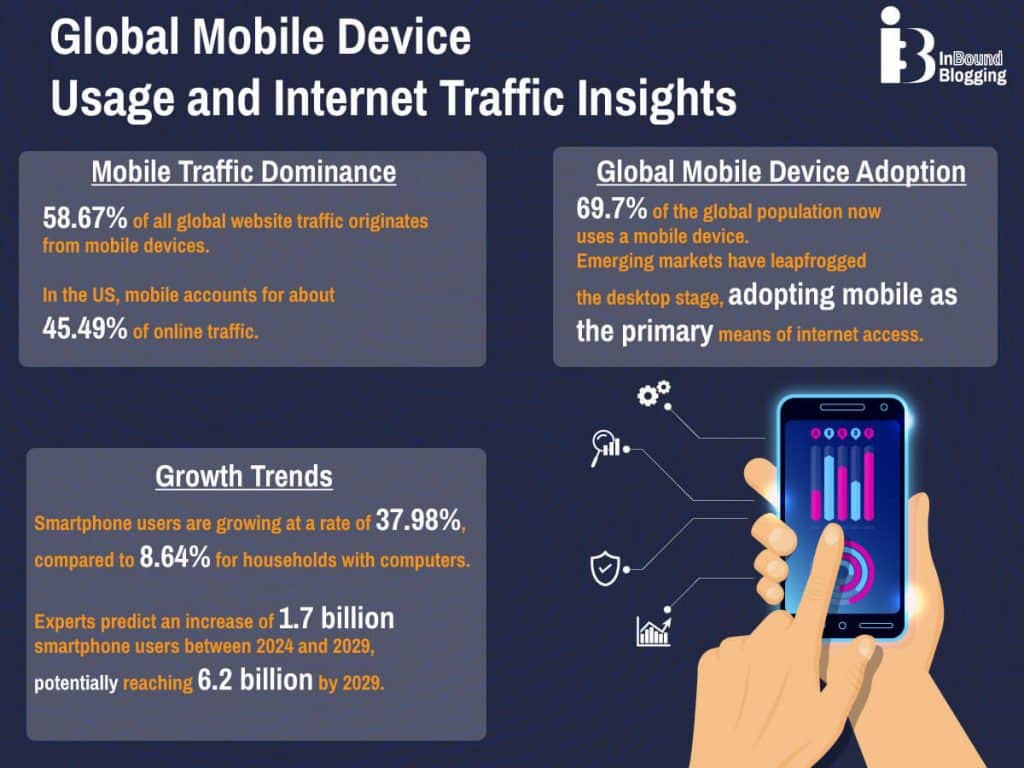
- The global number of smartphone users is expected to reach 6.2 billion by 2029.
- 58.67% of all website visits come from mobile devices instead of desktop computers.
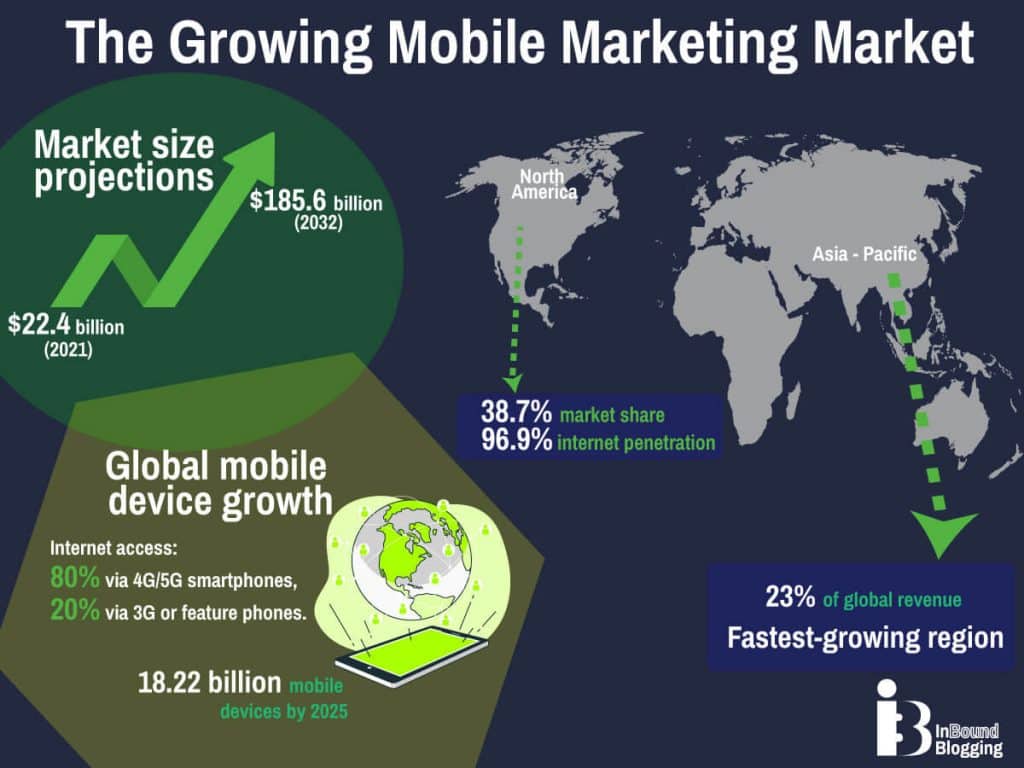
- The mobile advertisement industry is set to become a $185.6 billion powerhouse by 2032.
- Around one-third of a person’s daily waking hours—about five hours—is spent on mobile devices.
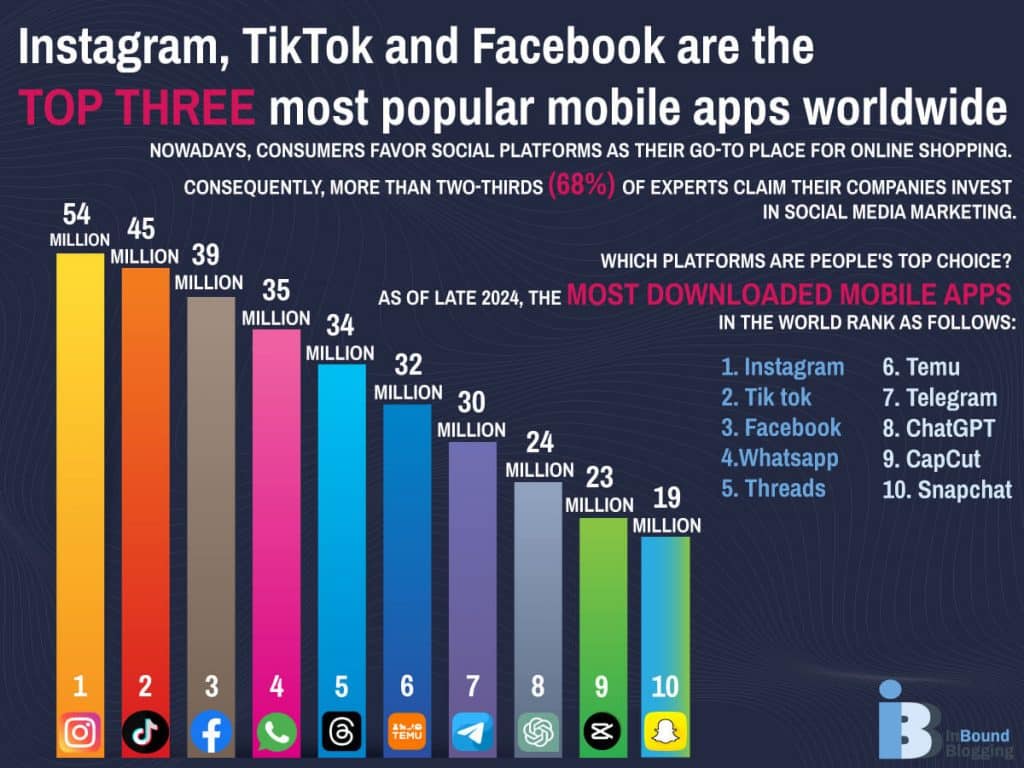
- Instagram, TikTok, and Facebook are the top three most popular apps in the world.
- According to mobile advertising trends, Meta holds the largest share (19.5%) of ad spending via mobile technology.
- Video ads and interactive content are the most engaging formats to get your marketing message across.
Top 10 Mobile Marketing Statistics for 2025
Smart devices are becoming cheaper and more accessible each year. If you want to create a killer mobile marketing strategy, you have to master optimization, smart insights, and dexterity.
The following benchmarks are a top resource for experts and business owners looking for wins in the dynamic world of mobile advertising in 2025.
1. The global mobile marketing market is set to hit $185.6 billion by 2032

The collective number of mobile devices worldwide is predicted to hit 18.22 billion in 2025. About 80% of people access the internet from a 4G or 5G smartphone. The remaining 20% of mobile users rely on 3G smartphones or basic feature phones to get online. As we keep adding more gadgets to our everyday lives, the digital advertisement market grows in response.
Just two years ago, the industry was valued at $22.4 billion. If it keeps up with the projected compound annual growth rate (CAGR) of 23.5%, it’s expected to reach $185.6 billion by 2032.
If we focus on regional mobile marketing trends, North America leads with over 38.7% of the entire market share. It shouldn’t be a surprise—the continent has the second-highest internet penetration rate in the world (96.9%).
North America is also home to big-name tech brands in the tech scene such as Microsoft, IBM, and Google. All of these companies are increasingly investing in automation and innovation in an effort to attract and retain customers.
The Asia-Pacific region is expected to scale rapidly as well. It’s the fastest-growing mobile market, making up over 23% of global revenue with a projected CAGR of 20.2% from 2024 to 2031. Businesses in this region understand that mobile is no longer a secondary medium. Targeting internet users who are browsing on their phones gives brands a leg up over their competition.
2. 58.67% of all website traffic comes from mobile devices

About 69.7% of people around the world are now using a mobile device. The growth rate for smartphone users (37.98%) is considerably higher than that of households with a computer (8.64%).
Experts believe that between 2024 and 2029, we’re going to see around 1.7 billion more people using smartphones. If this growth in mobile adoption continues, the figure could reach 6.2 billion smartphone users by 2029.
It’s no wonder that mobile devices generate more than half (58.67%) of all website visits in the world. In the US, though, mobile still only accounts for about 45.49% of online traffic.
On a global scale, however, smartphones are the preferred browsing method in many countries. Several emerging digital markets lagged on internet penetration rates and stable infrastructure. As their economies evolved, they completely skipped the whole desktop computer stage and went straight to using mobile internet.
3. People spend an average of 5 hours a day scrolling on their smartphones
Right before the COVID-19 pandemic hit, the average daily screen time of US mobile users was about 3 hours and 45 minutes. This figure is expected to shoot up to 4 hours and 39 minutes by the end of 2024.
As smartphones become more accessible and our dependency on digital devices rises, we can hardly expect this tendency to falter.
It’s a trend we observe on a global scale. People in the top 10 mobile-first markets spend an average of five hours a day on their phones. Impressively, that equates to roughly one-third of their waking hours.
With people spending more time on apps and social media platforms, optimizing the mobile experience is a non-negotiable for marketers worldwide.
4. 61% of consumers say they are more likely to purchase from mobile-friendly websites
How your website looks and how fast it loads on phones and tablets directly impacts conversion rates. 61% of people are more willing to shop online from mobile-friendly websites.
Given all the data on how much time people spend on their smartphones, should businesses in 2025 go for an app over a mobile website? The smartest move is to have both.
A mobile app is a company’s dedicated engagement channel for creating a loyal customer group.
But you can’t skip on a solid, responsive mobile site. Search engine optimization (SEO) is key for new users who discover a brand online or aren’t ready to download an app yet. This is especially true for brick-and-mortar shops that rely on Google Business Profiles, for instance, to attract local shoppers.
5. 81.9% of all mobile advertising spending will occur on apps
Statistics on mobile marketing show that 78% of smartphone users have tried out a brand’s app while checking out their products in-store. A well-positioned ad can turn that casual visit into a conversation.
Mobile ad spending in the US specifically is set to hit over $200 billion this year. Most of that investment (81.9%) will go to in-app marketing. It’s actually where 66.0% of all digital ad spending in the country goes.
6. Ad costs are on the rise: Facebook Ads are projected at $15 CPM and Google Ads at $11–$12
Before the COVID-19 pandemic, advertisers could snag 1,000 views on Facebook Ads for just $9. However, costs have been rising steadily since 2020. Today, businesses can expect to pay $17.60 per 1,000 views for targeted ads on the social platform.
The second-largest player in the digital marketing industry, Google, follows a similar trend. Under the pressure of new privacy regulations, such as GDPR and changes in consumer behavior, Google has forced marketers to switch gears.
As the world started bouncing back from the lockdown economy, advertisers upped their digital budgets. For this year, mobile marketing stats show that Google’s cost per mile (CPM) ranges between $11 and $12.
7. TikTok’s rapid growth can’t top Meta’s 19.5% ad share yet
TikTok mania has taken over the world, mobile advertising included. Marketers quickly noticed the untapped potential in the massive Gen Z user base of the short video-sharing app. Ever since it took off in 2020, ad spending on the platform has gone up by 150%.
But despite younger users switching gears to TikTok, advertisers are still putting 19.5% of their budgets in Meta platforms.
Why is that so?
The key is demographics with purchasing power. How much time do adult social media users in the US spend on each platform? Digital marketing statistics show a direct correlation between that and the percentage of ad spending. Here are the statistics and facts to know in 2025:
| Platform | Share of time spent on the platform (%) | Share of total digital ad spending (%) |
| Meta | 7.6% | 19.5% |
| YouTube | 7.5% | 5.8% |
| Hulu | 5.1% | 1.6% |
| TikTok | 3.7% | 2.3% |
| Snapchat | 1.8% | 0.8% |
8. Rewarded video is the leading mobile ad format with a $10.50 eCPM in 2024
Next, let’s analyze which ad formats grab the attention of mobile users the most.
Internet advertising is no longer limited to a static banner on a web page. Today, brands are willing to pay the most for rewarded videos—$10.50 per 1,000 views, according to recent marketing data.
As you can guess by the name, a rewarded video ad gives users some kind of bonus for watching it. This could be an extra life in a mobile game, virtual coins, or more time on a free trial. So, it’s a win-win: users get a perk, and advertisers get more views.
Rich ads and interactive media come in at second place. Playable promotions where users can try out a mobile game are the top earners in this category. These are engaging and, once again, the gamification aspect means people are more likely to convert.
Below is a table that ranks the most lucrative mobile strategies based on ad types and their estimated cost per 1,000 impressions (eCPM) in 2024:
| Ad type | eCPM (2024) |
| Rewarded video | $10.50 |
| Playable rich media | $9.00 |
| Interactive rich media | $7.00 |
| In-stream video | $6.50 |
| Programmatic guaranteed ads | $5.50 |
| Expandable rich media | $5.40 |
| Out-stream video | $5.00 |
| Private marketplace programmatic ads | $5.00 |
| Interstitial ads | $4.80 |
| Open auction programmatic ads | $3.60 |
| Native ads | $3.30 |
| Banner ads | $2.80 |
However, it’s not just the format that matters when optimizing your digital marketing campaigns. It’s also important to consider the device models that most people own.
Let’s see what the following mobile marketing facts have to say about that.
9. 51% of global mobile programmatic ad traffic in 2024 was delivered to Apple iPhones
Smartphone usage keeps climbing. Global mobile phone ownership grew by 78.05% between 2016 and 2020. In the US alone, it’s expected that nearly 87% of people will own a smartphone by 2025, up from just 27% in 2010.
As we all know, two major players rule the scene—Apple and Android devices. Android is by far the most widely used mobile operating system (OS) with about 71.65% over 27.62% for Apple’s iOS.
However, as of this year, iPhones hold a 51% market share based on open programmatic advertising data. Over the past year, their share of voice (SOV) grew by 6%. This means that more than half of the mobile ads being served are targeting iPhone users.
Since July 2022, Apple’s market share has consistently remained above 45%, showing strong dominance in the mobile market.
Why would marketers target iPhone owners over those with Android devices?
iOS users represent a more valuable demographic for advertisers. Despite the emergence of premium Android devices like the Samsung Galaxy series, iPhone fans are known to generally occupy a higher economic position. iOS users also tend to download and use more apps.
But which are the most downloaded apps that marketers should target? Read on to find out.
10. Instagram, TikTok, and Facebook are the top three most popular mobile apps worldwide

Nowadays, consumers favor social platforms as their go-to place for online shopping. Consequently, more than two-thirds (68%) of experts claim their companies invest in social media marketing.
Which platforms are people’s top choice? As of late 2024, the most downloaded mobile apps in the world rank as follows:
| Rank | App | Downloads |
| 1. | 54 million | |
| 2. | TikTok | 45 million |
| 3. | 39 million | |
| 4. | 35 million | |
| 5. | Threads | 34 million |
| 6. | Temu | 32 million |
| 7. | Telegram Messenger | 30 million |
| 8. | ChatGPT | 24 million |
| 9. | CapCut | 23 million |
| 10. | Snapchat | 19 million |
These figures include downloads from both the iOS App Store and Google Play.
We can clearly see that most of these fall into three main categories: online communication, entertainment, and mobile shopping.
Facebook was the first social network to hit over one billion active accounts in 2012. Today, it has more than three billion monthly users. Mark Zuckerberg’s Meta is an undisputed market leader—the company owns four of the platforms in the above chart.
An intriguing entry on this list is ChatGPT. The hype around artificial intelligence (AI) has blown up since the launch of OpenAI’s sensational generative bot. As a result, software with AI-related keywords has flooded app stores ever since.
In 2023, over 4,000 apps included the word ‘chatbot’ in their descriptions, and more than 3,500 threw in ‘GPT.’ This is almost twice as many as all the AI apps launched in the previous four years together.
Follow the link for more social media marketing statistics.
Final Thoughts
What is one thing we can take away from these essential mobile marketing statistics?
Creating a positive mobile experience isn’t just beneficial; it’s a must. In a world where clicks increasingly come from smartphones over desktops, a robust digital marketing plan must consider the unique aspects of consumer behavior on mobile devices.
Without optimizing for mobile, brands risk a decrease in engagement and conversions—negatively impacting their campaign performance and their bottom line.
References
- https://e.infogram.com/_/bIRQVyDIdHeiWznXf7ar?src=embed&mkt_tok=MzUxLVJXSC0zMTUAAAGWUtAZaff7Qc1M4332Lj-EMow7QiD3NkE4XQwOL_0LYPV1KjMWyT1Wknb35bzv5ns7Fs5hb-wJVv35Finjhp6qy_SOa7VwAN5ei6NJfsTkCQhs
- https://www.statista.com/statistics/245501/multiple-mobile-device-ownership-worldwide/
- https://www.sphericalinsights.com/reports/mobile-marketing-market
- https://www.gsma.com/r/wp-content/uploads/2024/10/The-State-of-Mobile-Internet-Connectivity-Report-2024.pdf
- https://www.statista.com/statistics/269329/penetration-rate-of-the-internet-by-region/
- https://datareportal.com/reports/digital-2024-april-global-statshot
- https://www.statista.com/forecasts/1143723/smartphone-users-in-the-world
- https://www.statista.com/forecasts/1146269/computer-households-in-the-world
- https://www.statista.com/statistics/277125/share-of-website-traffic-coming-from-mobile-devices/
- https://www.wpbeginner.com/research/web-design-industry-statistics-and-latest-trends/
- https://www.emarketer.com/content/mobile-advertising-2024
- https://www.thinkwithgoogle.com/marketing-strategies/app-and-mobile/business-app-strategies
- https://www.emarketer.com/uploads/pdf/email/EMKT2024_AudDev_SocialMediaEra.pdf
- https://www.businessofapps.com/ads/research/mobile-app-advertising-cpm-rates/
- https://www.statista.com/statistics/272698/global-market-share-held-by-mobile-operating-systems-since-2009/
- https://www.pixalate.com/mobile-device-global-market-share-report
- https://www.hubspot.com/hubfs/2024-Social_Trends_Report_V4.pdf?hubs_signup-url=offers.hubspot.com%2Fsocial-media-trends-report&hubs_signup-cta=Submit&hubs_offer=offers.hubspot.com%2Fsocial-media-trends-report
- https://appfigures.com/resources/insights/20241004?f=3
- https://www.statista.com/statistics/272014/global-social-networks-ranked-by-number-of-users/
- https://www.cognitivemarketresearch.com/regional-analysis/asia-pacific-mobile-marketing-platforms-market-report


